 Writing the previous post help me clarify what I want my readers to know after they have read or even skimmed my annual report.
Here is the list.
- I am very busy.
- I am getting busier.
- My client base is changing.
- The questions I am asked can be quite challenging and there are a lot of them.
- I make a difference.
- I am engaged in my community.
- I have updated the library’s content.
- I have upgraded the library’s technology.
- I am thrifty.
- I have a plan.
Today we are going to tackle the first three items on the list.
This will be the “pretty picture” part of the report that will use graphics to illustrate the statistical data on library usage. I use a little program called Gimlet to count questions and interactions I have with library patrons. With the data have logged for the last two years I can use graphics to effectively illustrate that:
- I am very busy.
- I am getting busier.
- My client base is changing.
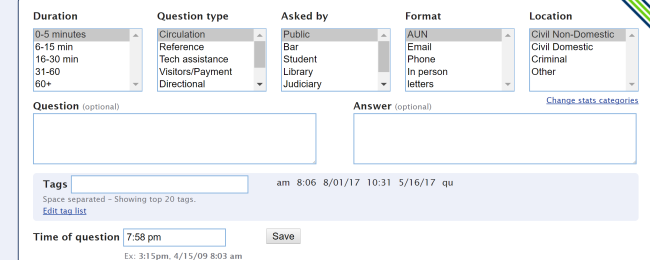
First, a bit about Gimlet. Below is a screenshot from Gimlet that shows what I log when a person asks me a question. Of course, the key is to actually use the program. My best guess is that I forget to add in a good quarter of the questions I receive.
Gimlet also gives a great standard report. Last week’s report is below.

Gimlet also has the ability to create custom reports based on any of the fields. It is a powerful tool. It is also handy to keep track of questions and answers for future reference. For $12 per month, it is a deal.
The Graphics for the Report
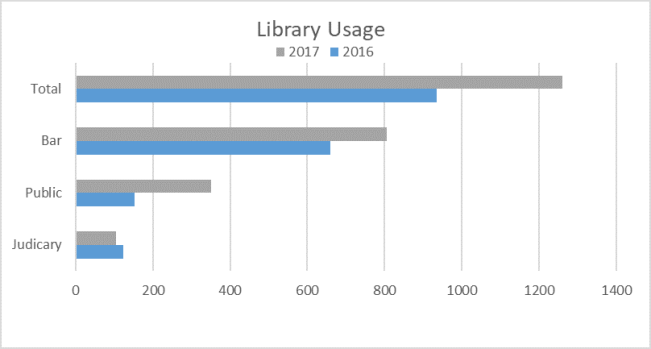
Here are the graphics for the report. FYI: I used an estimate for December. Once the month is over I will need to update the charts with the actual numbers from December.

The Report Will Say…
During the past calendar year, the Law Library has seen a 25% increase in its use. In 2017 over 1200 individuals either visited, emailed, or called the Law Library. In 2016 an average of 78 people used the services of the Library each month; in 2017 that number increased to 105.
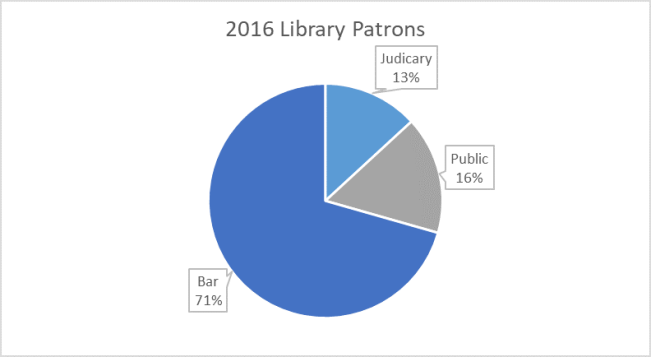
The demographics of library patrons also saw a significant shift during this time with a large increase in library use by non-attorneys. In 2016, non-attorneys who used the law library represented 16% of its visitors; in 2017 almost 30% of library visitors were non-attorneys.

Can’t wait for more–the 10 points are really succinct, not the gibberish of some reports. Good going!
LikeLike
Pingback: A Day in the Life | My First Law Library